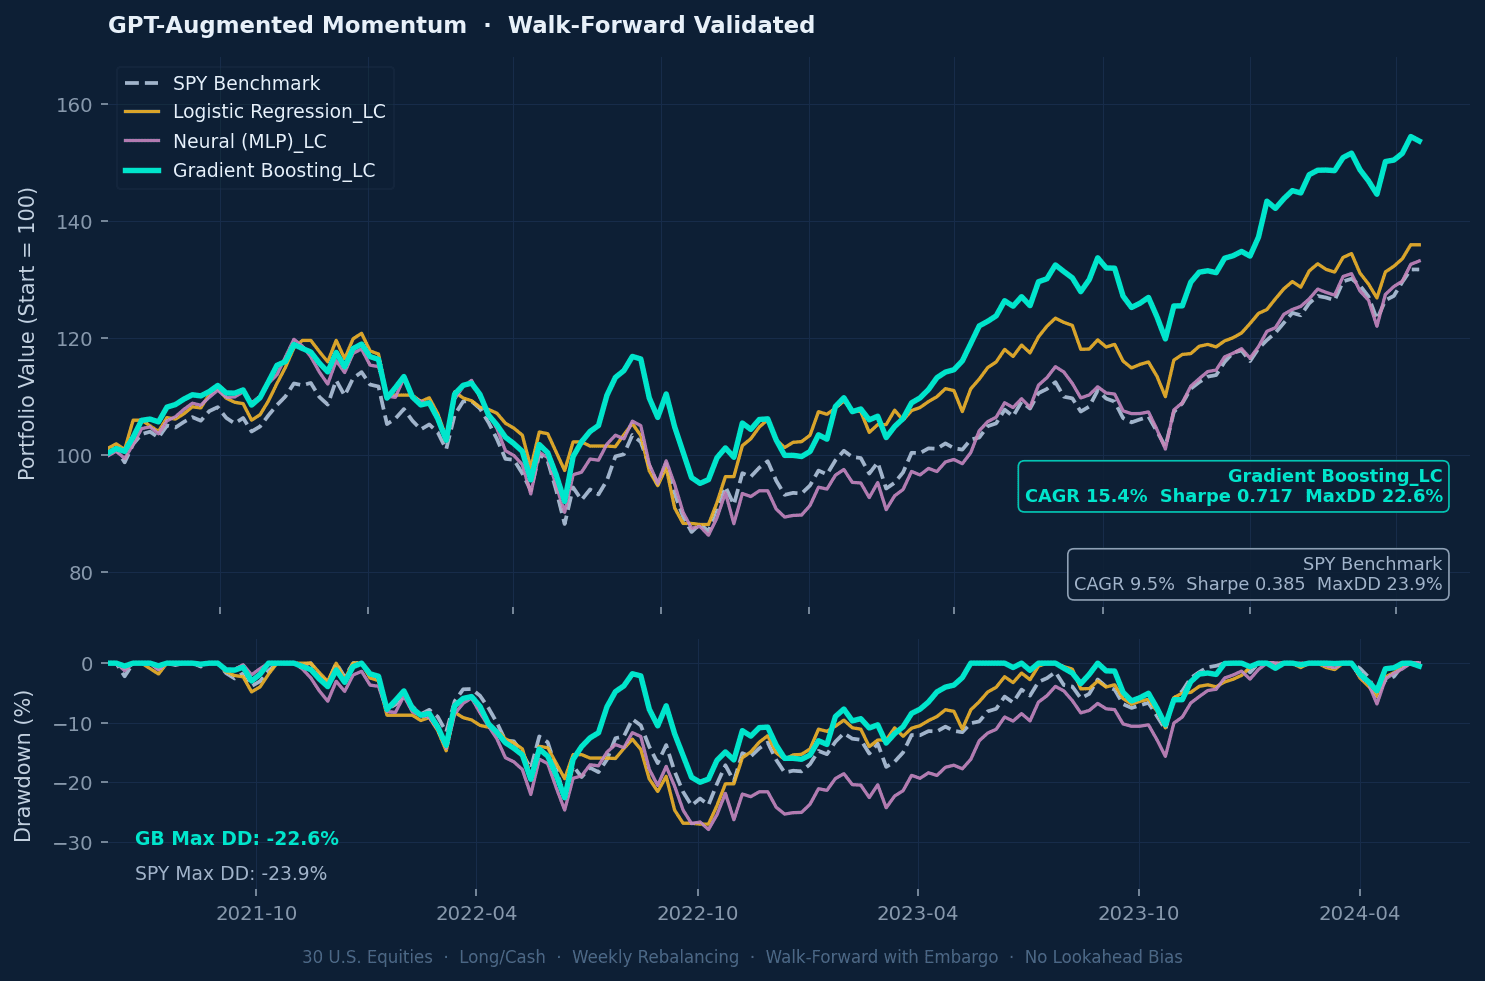
15.4%CAGR
0.717Sharpe Ratio
22.6%Max Drawdown
5 yrsOut-of-Sample
The one metric that separated
real alpha from overfitting
A free research kit for quant researchers, PMs, and algo traders — equity curves, methodology, and a Python notebook you can run in Google Colab in 5 minutes.

Strategy Results PDF
Methodology One-Pager
Python Colab Notebook
Early Access — Issue 02
Get the Research Kit — free
Enter your name and email. No credit card. No account creation.
No spam. Unsubscribe anytime. New issues published monthly.
The Signal · Issue 01 · April 2026
Walk-Forward Validated · 2019–2024
Strategy Performance vs Benchmark
Risk-Adjusted Performance Through Market Regimes
Rolling Sharpe Ratio — How Models Survived 2022
Static Sharpe ratios hide the real story. This 26-week rolling window reveals which models collapsed during the 2022 rate shock — and which recovered fastest. Gradient Boosting was the only model back above 0.7 within six months.
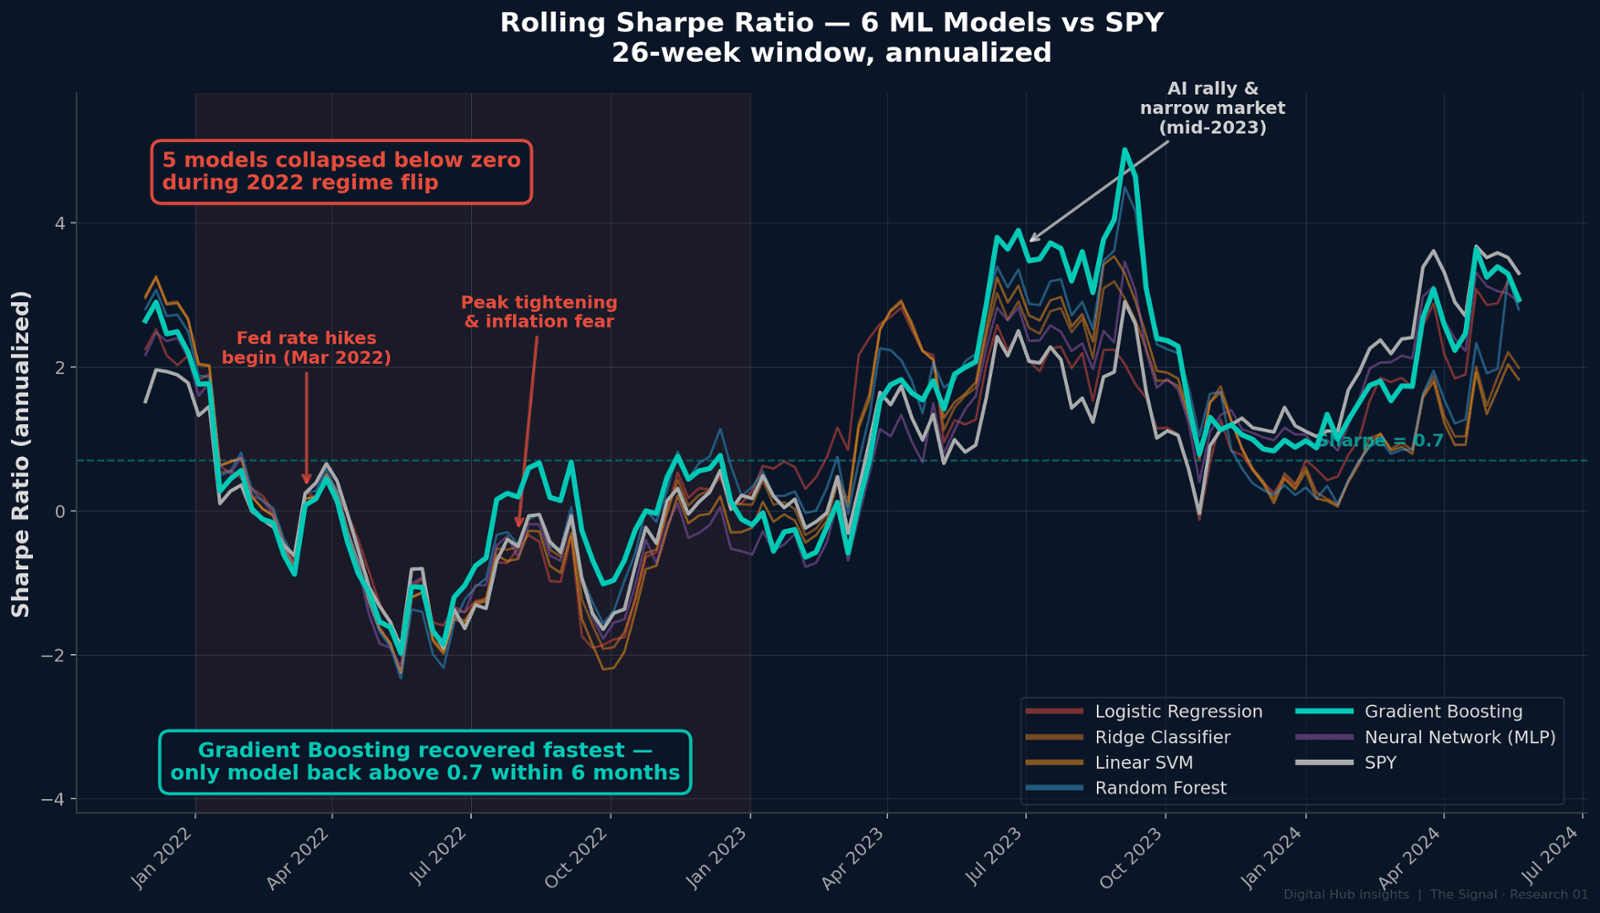
26-week rolling window · Annualized (√52) · Walk-forward validated 2019–2024
Canonical Results
By the Numbers
| Model | CAGR | Sharpe | Max DD | Final Value |
|---|---|---|---|---|
| Gradient Boosting | 15.4% | 0.717 | −22.6% | $166K |
| XGBoost | 14.1% | 0.691 | −21.8% | $159K |
| Random Forest | 12.7% | 0.654 | −24.1% | $148K |
| SPY Benchmark | 9.5% | 0.385 | −23.9% | $133K |
"GPT-augmented pipelines now compress months of research into hours. But humans retain control of credibility — data integrity, leakage detection, economic plausibility. The bottleneck in quant research has shifted from implementation to judgment."
Mehrzad Mahdavi, PhD · Founder, Digital Hub Insights
Former CIO · 30+ years in data science & algorithm development
Get the Research Kit. Free.
Two PDFs + walk-forward code template. Real data. Walk-forward validated.
Get the Research Kit →