Maximum Draw Down Analysis
One very common risk metric used to evaluate investment performance is the maximum drawdown. The maximum drawdown is the worst loss experienced between a peak value and the bottom, where the investment starts to regain its value and eventually retake that previous peak. In other terms, we can say it is the worst peak-to-rough return experienced by the investment over a certain investment horizon.
Maximum Drawdown in Python
Maximum drawdown is an excellent risk metric and possesses many advantages over other common ones such as standard deviation and Condition Value-at-Risk (CVaR).
It is very intuitive and easy to understand, whereas standard deviation and CVaR can be a little trickier.
You can easily compare all investments within a peer group and very quickly get a feel for how each one can do in a worst-case scenario.
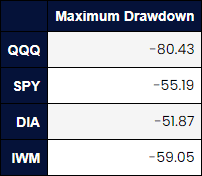
Table 1 shows the maximum drawdown experienced for 4 asset classes between May 2000 and July 2024.
However, simply considering only the maximum drawdown doesn’t tell you much. For instance, it doesn’t tell you when it occurred (you could isolate the date), it doesn’t tell you how long it took to recover from the drawdown and retake the previous peak, and it doesn’t tell you how long it took to reach the bottom.
We can thus expand our drawdown analysis with a few more intense and thorough techniques.
The Underwater Graph
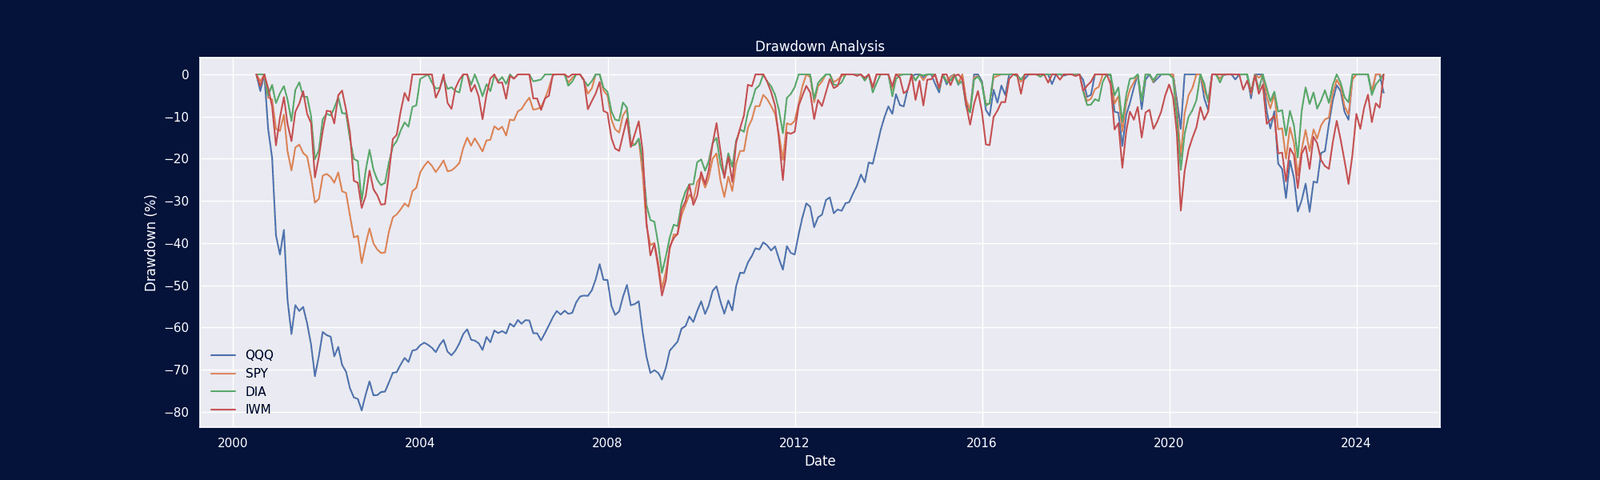
One way to improve upon the maximum drawdown is to produce a drawdown graph, commonly referred to as the underwater graph. The underwater graph has a maximum y value of 0. Meaning, we only plot when the investment starts producing negative returns from a peak value. You can see in figure 1 the underwater graph for NASDAQ (QQQ) and the Dow Jones Industrial Average (DIA). We can clearly see that QQQ has more frequent and more severe drawdowns. It is a great visualization. We can infer the time it took to hit each bottom in that drawdown, and then how long it took to regain the x-axis (y=0). However, we cannot extract the dates, and the duration of the drawdown.
A Complete Drawdown Analysis
What we really want to know is:
What was the peak value?
How long did it take to fall to the bottom?
How long did it take to recover?
What was the total duration of the drawdown?
What was the peak to trough return?
Armed with this information, we can get a much better sense of how our investment strategy behaves, and we are in a much better position of comparing investments since we can look at these metrics and hopefully come to conclusions, such as (for example):
Investment 1 has more severe drawdowns but recovers very quickly.
Investment 2 has shallow drawdowns but tends to stay underwater longer.
Identify how these investments behaved during a similar period of market stress.
That’s incredibly powerful information to have that can help you decide between two investments when conducting investment due diligence.
The Python code provided along with this article will allow you to ask the following question:
How many times during the time period under investigation (say 20 years) did an investment fall by at least 10%? You can then extract every time the investment fell by more than your chosen threshold and get all the information and statistics in our complete drawdown analysis list presented above.
You can then extract every time the investment fell by more than your chosen threshold and get all the information and statistics in our complete drawdown analysis list presented above.
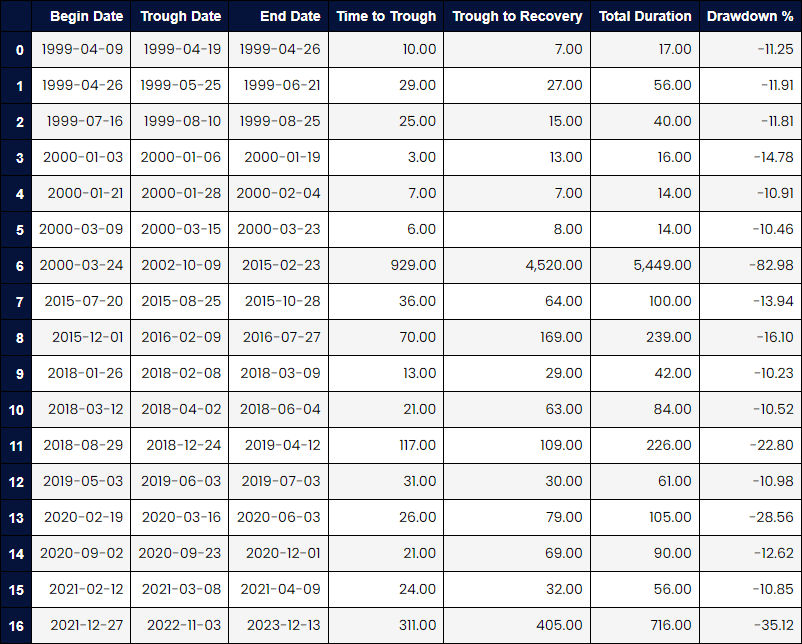
Table 2 shows every drawdown for QQQ since 1999 more than 10%. This means that the drawdown is triggered once QQQ fell at least 10% from a peak value using daily data. The columns Time to Trough, Trough to Recovery, and Total Duration are in days.

You can also do this for multiple investments and extract a wealth of information that will help you analyze and compare various investments, including your own trading strategies.
Monthly or Daily Data?
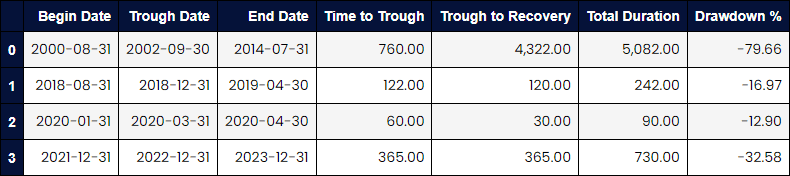
We are left with one key question. Should we use daily or monthly returns? There is no correct answer here. Using daily data will more closely match what people see if they monitor their investments daily. You will likely see more frequent and more severe drawdowns when using daily data. Table 3 shows all drawdowns for QQQ in excess of 10% using monthly returns, which we can compare to table 2.
We can easily see the difference. This is because monthly returns will smooth out the noise we are subjected to with daily returns.
If you are analyzing investments for long-term portfolio construction purposes, you are better off using monthly data.
Otherwise, it is never a bad idea to try both just to get a sense for how investments behave.
Conclusion
The drawdown analysis is a powerful tool in the investment due diligence tool kit. However, we mostly see maximum drawdown and most commercially available software packages only consider maximum drawdown.
This is why we at Digital Hub Insights are empowering everyone out there to go beyond what is out there and arm you with tools that you can’t get anywhere else.
Please sign up to get our code templates, receive our newsletter, and prepare yourself for our courses which we are launching soon. We will be offering the ultimate bridge between finance, machine learning and data science, taught to you by professionals who do this for a living. And we are willing to share our strategies and code!
This is why we currently have over 23,000 subscribers to our newsletter.
And we are so excited to soon launch our Machine Learning, Portfolio Construction and Management Python courses!