
Digital HUB is an open online community of financial and data science professionals pursuing practical applications of AI in their everyday functions. Digital HUB community provides expert, curated insights into financial applications of Generative AI, Large Language Models, Machine Learning, Data Science, Crypto Assets and Blockchain.
A key focus for The Digital HUB publication is to provide best practices for the safe deployment of AI at scale such as: assessing the ability to execute, determining an organization’s digital DNA, fostering skill development, and encouraging responsible AI.
Highlights
- Selecting investment managers is a difficult task, but using quantitative tools wisely may shift the distribution of outcomes for you or your clients.
- Exploring the data using statistics and probability, and uncovering patterns in the data with unsupervised models, can narrow the universe of managers to a more reasonable pool.
- Linear regression and supervised machine learning models are effective at determining the true factor exposures of a fund, and they might be able to help select superior managers.
- The model development process is not simply finding the model with the best score. Explicitly embedding a deep understanding of the investment domain in your model will go a long way.
This article is the first in a series on quantitative manager selection. It is written from the view of an allocator—a family office, a private wealth manager, a model portfolio designer—someone who does not analyze individual securities, but instead analyzes the people who do. The core problem and framework we have developed to address said problem, however, generalizes quite nicely to many other investment vehicles, so the principles discussed here can be extended to many different areas of the market. This inaugural article seeks to introduce the topic and give a high-level roadmap of what is to come, whereas future newsletters will expound upon the presented cases and techniques in an effort to keep the material self-contained and well-organized (and shorter, because I know you didn’t read all eight pages I wrote last time 😉).
For allocators, the selection of good funds is paramount to the success of the portfolio. Much like any other investment selection process, however, the odds are stacked against the investor. There are many sites out there that provide an overwhelming amount of data on funds. And if an investor does not have a reasonable framework to take advantage of that data, it is nearly impossible to maintain parity with other investors, let alone gain an edge. To illustrate that point, below is my estimation of the likelihood of underperformance for U.S. Equity fund managers. [1].
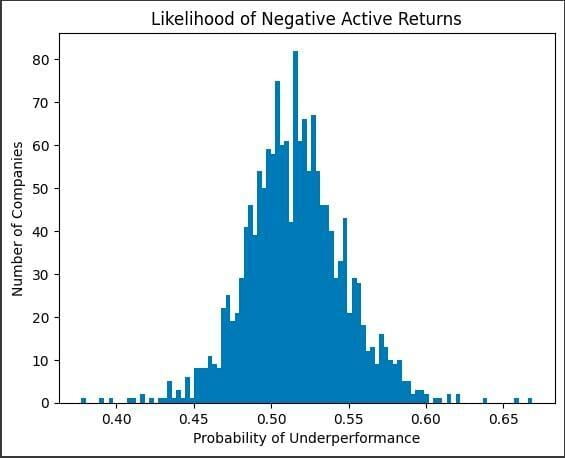
Graph produced with matplotlib library using data publicly available from MorningStar. Analysis by Lucas Bunting, CFA
The histogram above suggests less than 25% of U.S. Equity managers are expected to outperform their benchmarks net of fees, assuming the past ten years of monthly data are indicative of future long-term performance. This reality makes the job of the allocator extremely difficult. Fortunately, there are quantitative tools that can help investors take advantage of the data professionally managed funds are required to report to the investing public. Over the course of the next several newsletters, we will dive into these topics individually, but for now, we focus on setting the context and whetting appetites.
Exploratory Data Analysis Can Take You a Long Way
The distribution above was not created with any machine learning model. It was done using a basic understanding of probability and python. Before sinking time into specifying and tuning a model for cross-sectional fund selection, it is typically advised to attempt to shift the entire distribution under evaluation. For example, perhaps we hypothesize U.S. Large Cap Equity fund managers have a difficult time beating the S&P 500. (And we would be right [2] [3].) You could do what I did above and try to predict probabilities using historical data. Or, you may find it useful to break the data up into “up” years and “down” years to determine which funds do well in downturns. Perhaps it is beneficial to identify and throw out funds that hug the index and charge a fat fee to do it. EDA can help you screen out the universe before building the model. It is just as valid (perhaps even more so) as any rudimentary or sophisticated model out there. You just don’t look as cool doing it.
Linear Models Are Tough to Beat
Once you’ve narrowed the pool by conducting EDA, you can embark on the modeling process. Let’s say you discover it’s too hard to pick a good U.S. Large Cap Growth manager, so you decide to buy a low-cost passive fund for that space. Maybe U.S. Small Cap Value has potential. You find a list of funds by average market cap and make a cutoff that suits your strategy. One way of proceeding is by linear regression. You can estimate factor returns (growth, value, volatility, momentum, quality, etc.), and then regress the returns of the funds against those of the factors. The output gives you the fund’s exposures to each of those factors, narrowing your list down to the funds that actually give you the value exposure you need for your portfolio. As an aside, instead of doing this “top-down” from the returns, you can also use the holdings themselves and build from the “bottom-up” the exposures of the funds. No matter how you do it, focusing on managers that give you the exposures you seek is important in limiting the universe, but also has implications for portfolio construction which we will discuss at a later date.
Unsupervised Learning Models Can Assess Similarity
If you decide against measuring factor exposures, you have another option with unsupervised learning. Feeding lots of (1) relevant, (2) useful, and (3) clean data into a model like k-means hierarchical clustering can help you uncover similarities between funds that may not be easily observable. It may also be complete nonsense; you’ve been warned. Knowing what is signal and what is noise will come down to the intuition developed from understanding both the model and the domain.
Principal Component Analysis would also fit under this umbrella. Constructed well, PCA can effectively reduce the dimensionality of the dataset (by effectively removing noise) and also constructing new orthogonal factors, at the expense of interpretability. Nonetheless, it can be used to understand how certain funds react to changes in inputs, or in determining how many components actually drive the bulk of the variance.
Supervised Learning Is Versatile
While we used PCA above to remove dimensionality from our problem, sometimes it can be helpful to model it. So long as there is economic rationale for why high-dimension non-linearities may exist between a target variable and its features, a machine learning model can be employed to capture those relationships. A straightforward way to do this explicitly would be to run a linear regression and pull the residuals. Then, use the residuals as inputs to a machine learning model so it can try to map the non-linear aspects of the relationship.
We could also attack the problem straight on with supervised learning models. If we want to determine which funds will outperform, and/or which ones will underperform, you could use a wide array of models. You could start with logistic regression, then use a support vector machine, a decision tree, and even a neural network. Training and tuning each of these to determine which model generates the best out-of-sample performance is the standard approach to modeling.
A Word of Caution
A function, f, maps inputs, X, to outputs, y: X→f→y. We don’t know f, but we have X and y. In a supervised problem (i.e. you have a y) you are estimating f. What makes ML effective in several domains is that it can efficiently estimate complex fs. In the finance and investment world, we have a very low signal-to-noise ratio, so the likelihood of overfitting the model to noise is high. Even with the best intentions, we can fall victim to a model that appears more performant than it actually is. How?
- Hindsight is 20/20. Just by being a market participant, you are influenced by what has worked and what hasn’t. We know that Large Cap companies in the U.S. have dominated the last decade. If you knew nothing of Fama-French, you may decide Size (large cap minus small cap) is a good factor to include in your model. It would be easy to rationalize the inclusion of such a factor ex-post by citing economic intuition. When you backtest your model, it’s almost guaranteed to do better.
- The evolution of the model is, itself, a path. Quants talk a lot about path dependency, which is essentially the butterfly effect. Take, for example, a typical workflow where you want to see if a tweak to a model’s hyperparameter yielded better results. After running a trading simulation for each model, it appears the updated model performed better. Unbeknownst to you, the original model was actually the superior model, but because of the time frame of the simulation, the starting portfolio, and a few chance interactions, it appeared to underperform. Now examine the big picture here. If you choose the inferior model because it appeared to improve the results, it becomes the new benchmark model against which future tweaks will be measured. This can ultimately lead to a worthless model, subpar results, or local maximum where you can’t make any changes to the model because all changes appear to make it worse, i.e. overfitting.
It can be extremely tempting to add data to the model because it worked in the past. And it is really hard to choose models that may underperform other options, since we quants are empirical by nature. But the best models are those that estimate f really well. A well-fitted model tends not to be the best performing in-sample model, and may not be the absolute best on cross-validation results. But they almost always are a combination of high-quality domain knowledge and a wisely selected model for the problem at hand.
This foray into the intersection of data science and manager selection is by no means an exhaustive discussion of the topic. We defined the formidable task at hand of picking good managers for our portfolio. We examined some exploratory approaches to narrowing the field. We took a look at how linear regression could be used to determine factor exposures. We dipped our toes into unsupervised and supervised learning. And importantly, we acknowledged the limitations and challenges we can face as empiricists in the investment domain. There is more to come on all topics discussed— for now, consider this a flight of beers with a keg for each on the way.
The views expressed in this article are my own.
Not investment advice.
[1] A t-distribution was fitted to each fund’s past active returns, and the parameters were used to infer the probability the manager will outperform in the future, assuming the strategy hasn’t changed. The primary source of the data was MorningStar, all of which was free on their website. Analysis was performed by Lucas Bunting.
[2] https://www.bloomberg.com/news/articles/2023-02-02/s-p-500-index-funds-outperformed-by-stockpickers-in-2022; while the article celebrates the victory of active funds over a 1-year horizon versus the S&P 500, it correctly acknowledges the long-term average is 35% of active funds beating the S&P 500. The fact that a victory for this set of funds was newsworthy should give you an idea of how this normally plays out.